output data
Output consists of:
- 2 forecast csv files:
- with a choosen horizon for each product, the associated forecast, the bounds linked to it.
- on the past with demand to compute error (biz side).
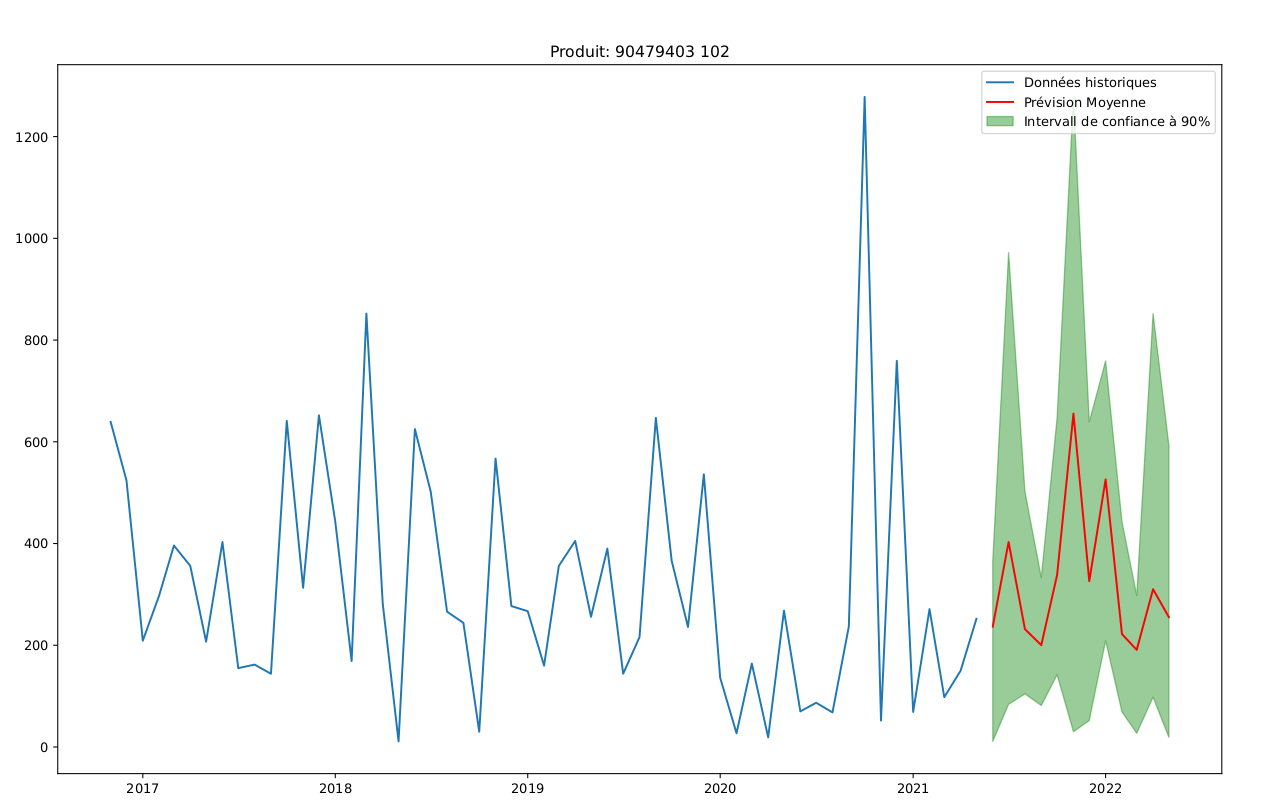
- A forecast pdf file:
for each product a corresponding graph with the past demand, the forecast and the confidence intervals.

What horizon to choose ? Weekly 12 weeks, Monthly 3 months?
Horizon: 12 next periods
Potential improvements — to discuss
- Analytics and kpis based on past
- Forecast errors based on validation offset
- Safety stock?